Expected credit loss under IFRS 9: the models, the judgements and what auditors test
ECL is a statistical modelling exercise wrapped in an accounting standard. How the framework fits together, where implementations go wrong, and the six areas auditors look at hardest.
Provisioning for loan losses used to look backwards. Under the “incurred loss” model that dominated accounting for decades, a loan was written down only once there was evidence the loss had already happened: a missed payment, a breached covenant, a borrower in trouble. The 2008 financial crisis sharpened the obvious criticism. By the time a loss is “incurred”, it is usually too late to manage.
IFRS 9’s expected credit loss (ECL) model, in force since 2018, changed the question. Lenders now estimate losses before they happen, and update those estimates every reporting period using current conditions and a forward-looking view of the economy. The same model applies under local equivalents such as AASB 9 in Australia and Ind AS 109 in India.
Other regimes followed their own paths:
- United States. The close analogue, CECL (ASC 326), took effect in 2020 for larger SEC filers and in 2023 for everyone else.
- Indian banks. Non-banking financial companies reporting under Ind AS already apply ECL, but banks stayed on incurred-loss provisioning for longer. The Reserve Bank of India issued final ECL directions in April 2026, taking effect from 1 April 2027 for most commercial banks.
ECL is not primarily an accounting exercise. It is a statistical modelling exercise wrapped in an accounting standard, and treating it as the former is the most common reason implementations run into trouble.
The framework
Because ECL provisions go straight into the financial statements, a sound framework needs several things at once:
- a clear business-model and SPPI (solely payments of principal and interest) policy governing how assets are classified;
- sound modelling for staging, segmentation, PD, LGD and EAD;
- documented policies and procedures;
- independent model validation;
- accurate reporting and disclosure;
- governance with clear roles across underwriting, treasury, finance, risk, IT and operations.
Skip any one of these and it tends to surface later, usually in front of an auditor or a regulator.
Three ways to measure impairment
Which approach applies depends on the asset, not on preference:
| Approach | When it applies | How ECL is measured |
|---|---|---|
| General model | Most loans, corporate exposures and bonds | 12-month ECL in Stage 1, lifetime ECL in Stages 2 and 3 |
| Simplified approach | Trade receivables and contract assets without a significant financing component (optional for some others, such as lease receivables) | Lifetime ECL from day one, no staging |
| Purchased or originated credit-impaired (POCI) | Assets already credit-impaired when bought or made | Lifetime ECL, discounted at a credit-adjusted effective interest rate |
The general model covers most of a lender’s balance sheet and is the only one that needs a staging judgement, so most of the modelling effort goes there.
Building the components
IFRS 9 is principles-based and does not prescribe one calculation. In practice, most institutions build ECL from three estimates, discounted back to today and summed over the relevant horizon (12 months or the remaining life):
ECL = Σ PD × LGD × EAD × discount factor
Definition of default
Everything downstream depends on one clear, consistent definition of default. It is surprisingly common to find different definitions running at once for internal risk, regulatory reporting and ECL, which quietly breaks the comparability of every number built on them. A workable definition usually draws on non-performing classification, restructuring due to financial difficulty and a qualitative “unlikely to pay” assessment. IFRS 9 includes a rebuttable presumption that default occurs no later than 90 days past due. Changes to the definition should apply going forward, not be used to restate history.
Segmentation
Segments should group exposures with similar risk and separate those with different risk. Splitting by product alone is the most common shortcut, and rarely enough. Common layers include:
- Geography: country, region, city tier.
- Portfolio type: corporate, SME, retail, home loans, trade receivables.
- Borrower characteristics: salaried or self-employed, income, internal rating or score.
- Portfolio characteristics: secured or unsecured, vintage, maturity.
- Portfolio management: underwriting and credit policy.
- Quantitative methods: clustering, principal component analysis, classification and regression trees.
The more a scheme relies on judgement alone, the harder it is to defend, and the more likely one model is being asked to describe several different risk populations at once.
Staging: significant increase in credit risk
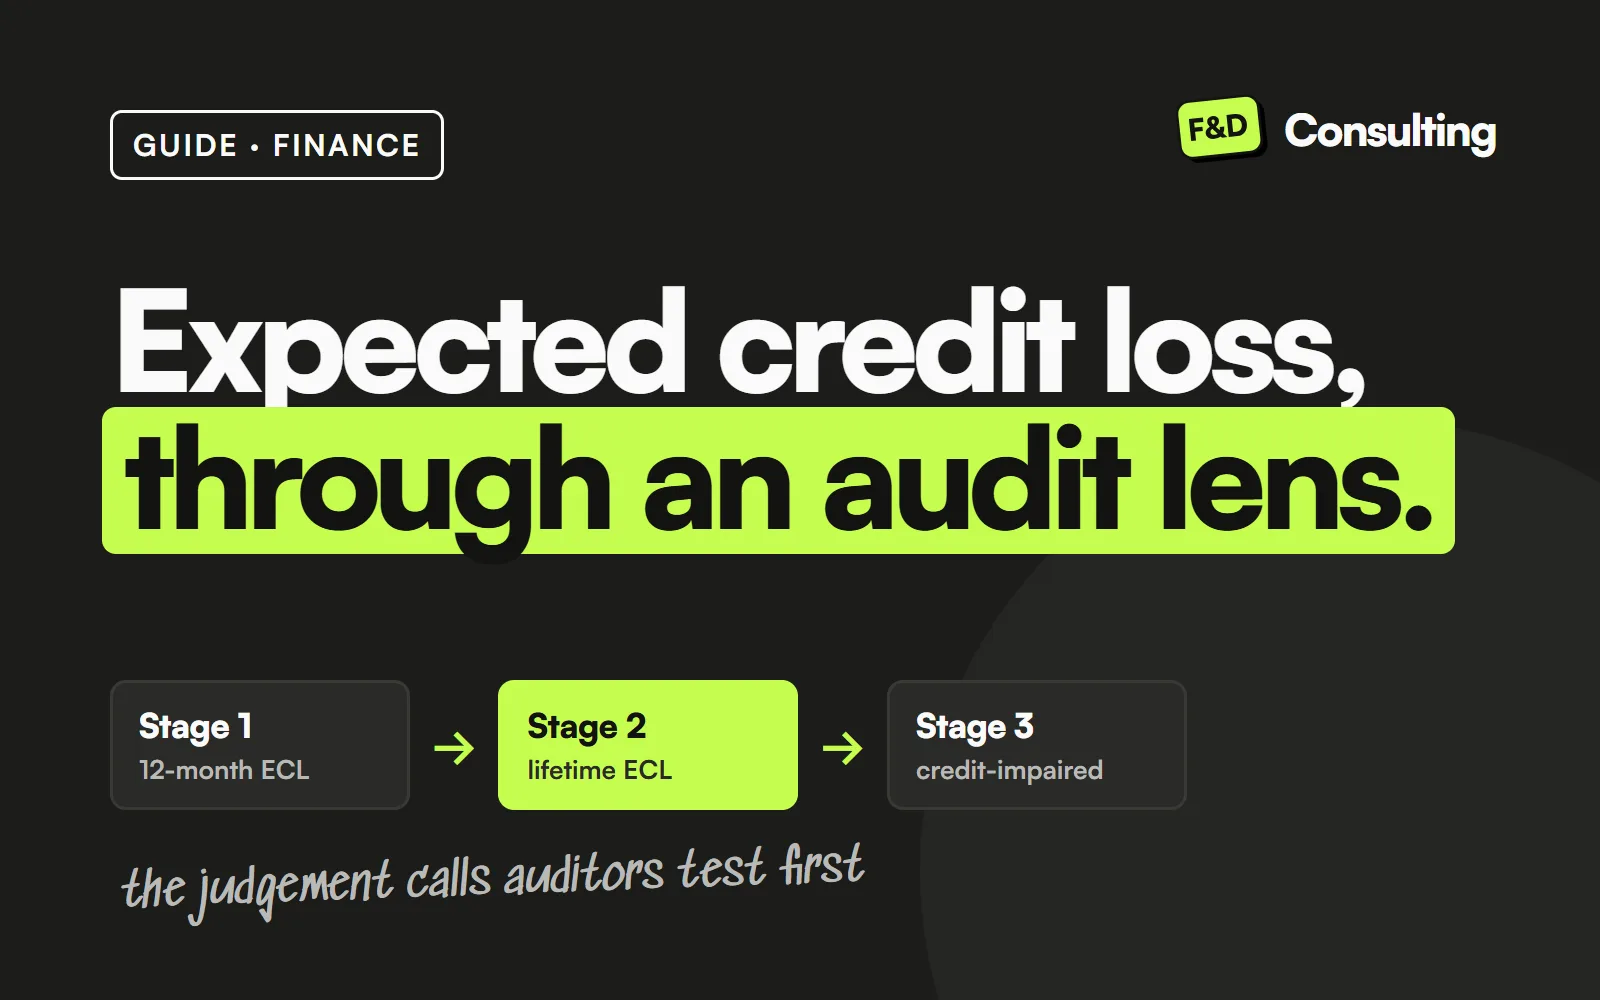
Every exposure under the general model sits in one of three stages:
| Stage | Meaning | Provision horizon |
|---|---|---|
| Stage 1 | No significant increase in credit risk since origination | 12-month ECL |
| Stage 2 | Significant increase in credit risk (SICR) | Lifetime ECL |
| Stage 3 | Credit-impaired or in default | Lifetime ECL |
Exposures can move back to an earlier stage if credit risk improves.
Common triggers for a move from Stage 1 to Stage 2 are:
- lifetime or 12-month PD at the reporting date compared with origination;
- rating or PD movement beyond a set threshold;
- IFRS 9’s rebuttable presumption of a significant increase at 30 days past due;
- restructuring due to financial difficulty;
- watchlist flags;
- covenant breaches;
- early-warning indicators.
Many institutions lean almost entirely on days past due and watchlist flags because they are simple to run, and rarely test where a rating threshold should actually sit. That threshold should be back-tested, not assumed. Reasonable minimum tests are:
- false positive and false negative analysis;
- stability analysis of how exposures migrate between stages;
- a check that staging outcomes move sensibly with the economic outlook.
Probability of default (PD)
ECL needs a point-in-time PD, one that reflects current conditions, not a through-the-cycle PD that smooths default rates over a full economic cycle. Institutions either convert an existing through-the-cycle PD (often from Basel internal-ratings work) with a macroeconomic overlay, or model the point-in-time term structure directly.
IFRS 9 does not prescribe a technique. Flow rates, behavioural scorecards, structural models such as Vasicek or Merton, hazard models and machine-learning methods are all legitimate. The right one usually depends on the data available.
Recurring weaknesses include:
- Not enough history. A full business cycle of data is often not used, even where it exists.
- Poor data quality: missing values, outliers and inconsistent records.
- No single borrower identifier across source systems.
- Legacy scorecards running for years without re-validation.
- Vendor models with no development documentation the institution can stand behind.
Loss given default (LGD)
LGD estimates how much of an exposure is lost after recoveries, whether from cash collections or collateral. The main approaches are:
| Approach | Based on |
|---|---|
| Workout LGD | The institution’s own recovery history |
| Market LGD | Market prices of defaulted instruments |
| Implied LGD | Credit spreads on non-defaulted bonds or credit default swaps |
| Statistical models | Regression, fractional logistic or decision-tree models |
| Regulatory LGD | Prescribed rates and collateral haircuts |
A single flat LGD applied to every stage and vintage is the most common shortcut. It systematically understates losses on older defaults, where the realistic recovery window has usually closed.
Better practice:
- Build an LGD term structure. Loss changes the longer an exposure stays in default.
- Use vintage analysis to find the window in which most recovery actually happens.
- Compute cure rates for accounts that default briefly and then return to normal.
Good collateral management, meaning proper allocation across facilities and regular revaluation, is one of the few levers that actually reduces LGD rather than just measuring it better.
Exposure at default (EAD)
EAD is often treated as the simple part and is frequently under-engineered.
- What it covers: principal, accrued and future interest, and the amortisation schedule.
- Undrawn facilities: for limits, letters of credit and guarantees, a credit conversion factor estimates how much will be drawn before default.
- Prepayment: the piece most often left out. Ignoring it usually overstates lifetime ECL, because it assumes exposures run longer than they do. Conservative is not the same as correct: a lender that never models prepayment is quietly over-provisioning on long-dated, low-risk books.
Discounting
Expected cash shortfalls are discounted at the effective interest rate (EIR), or a credit-adjusted EIR for POCI assets. Practical questions recur:
- which fees and costs form part of the EIR;
- whether to use contractual or expected life where prepayment or behavioural life applies;
- how to handle floating-rate instruments.
Forward-looking information and scenarios
This is what most clearly separates ECL from incurred loss. Estimates must reflect past experience, current conditions and reasonable, supportable forecasts, usually across several economic scenarios that are probability-weighted into one number. The same economic variables should, as far as possible, be used for ECL, stress testing and asset-liability management rather than drifting apart between teams. Scenario weights are judgemental, so the rationale needs to be documented and challenged, not simply asserted.
Post-model adjustments
No model anticipates a genuinely new shock. A post-model adjustment (PMA) is a deliberate overlay on the model’s output for a risk the model cannot see. Every PMA should:
- address a specific, named model limitation, with a method that is easy to follow;
- be documented in full;
- go through defined governance and sign-off;
- be back-tested over time for continued relevance.
A PMA that fails any of these is not a risk adjustment. It is an unexplained plug in the provision.
Validating the models
ECL outputs land on the profit and loss statement and affect capital, so model risk is usually managed through three lines of defence:
- First line: the team that builds the model.
- Second line: an independent function that validates it before use and on a set cycle afterwards.
- Third line: internal audit, checking that both did what their policies require.
| Area | What a validator checks |
|---|---|
| Data | Extraction, cleansing, imputation and feature engineering across the full pipeline |
| Methodology | Fit for the portfolio, against regulatory guidance and industry practice |
| Assumptions and limitations | Each assumption, its rationale and any mitigating control |
| Documentation | Clear enough for someone to understand the model without the developer |
| Implementation | The code or system that actually produces the numbers |
| Controls | Protection against unlogged changes in production |
| Overrides | Every management override, with its effect on the output measured |
| Sensitivity and back-testing | Robustness, and accuracy against what actually happened |
| Post-model adjustments | Need, size and method of every overlay |
Validation should scale with complexity. A machine-learning model warrants far more testing than a simple average-based approach. The validation policy should say so, and apply equally to vendor-built and consultant-built models.
Where implementations go wrong
Ask any institution mid-implementation what the hardest part has been, and the answer is almost always data before methodology. The recurring failure points:
- Data: limited history, poor quality, systems that do not join up, critical fields never digitised.
- Methodology: chosen without regard to the data, systems or people available.
- Process: weak coordination between the teams that extract data, run the model and report.
- People: key-person risk in one or two specialist roles.
- Systems: spreadsheets stretched past what they can reliably handle.
- Governance: unclear roles, no turnaround times, no escalation path.
- Management information: no dashboard that shows a provision trend moving the wrong way before it becomes a surprise.
Data gaps quietly push institutions towards simple backstops, not because they are the right technical choice but because they are all the data supports. That usually produces provisions that are more conservative and less sensitive to risk than a properly specified model would give.
ECL also reaches well beyond the credit team. Two effects are often underestimated:
- Pricing. Expected loss is recognised from day one, so lenders that price without it are effectively subsidising riskier borrowers with margin from safer ones.
- Capital. Higher provisions reduce retained earnings and capital, which flows into capital ratios and, through available stable funding, the net stable funding ratio.
Asset-liability management, stress testing, risk appetite and disclosure all feel the effect too.
Looking through an audit lens
ECL is one of the areas auditors and regulators scrutinise most closely in a lender’s accounts. The number is large, it moves every period, it comes from models rather than transactions, and much of it rests on judgement. It is usually treated as a significant risk of material misstatement. Because it cannot be simply re-performed from first principles, the auditor’s job is to assess whether the judgement behind it is reasonable, consistently applied and properly governed.
Six areas get most of the attention:
| Area | The auditor’s question |
|---|---|
| Data lineage and completeness | Can every input be traced to source systems and reconciled to the general ledger? |
| Model governance | Was each model independently validated before use, and on a set cycle since? |
| Staging judgement | Are the thresholds back-tested against how this portfolio has actually behaved? |
| Scenarios and weights | Is the rationale documented, approved and reviewed as conditions change? |
| Post-model adjustments | Is each overlay sized, approved and back-tested, or is it a plug? |
| Disclosure | Do the disclosures reconcile to the model output? |
Data lineage. Exposure counts, balances and days past due that do not tie to the ledger are among the fastest ways to lose an auditor’s confidence in everything built on top. Any cleansing, imputation or manual adjustment is itself an audit point: was it systematic, documented and consistent, or ad hoc?
Model governance. Auditors look for evidence that validation is genuinely independent of development, in resourcing, in reporting line and in its willingness to challenge and reject a model, not just review its documentation.
Staging. Moving from Stage 1 to Stage 2 switches the horizon from 12 months to the exposure’s whole remaining life, so even a modest deterioration can multiply the provision several times over. That makes the threshold one of the most consequential judgements in the framework. The auditor’s question is rarely whether it is defensible in theory. It is whether it has been back-tested against this portfolio, and whether a reasonable change would move the provision by a material amount.
Scenarios and weights. Probability-weighted scenarios are a source of estimation uncertainty that IFRS 7 requires entities to explain. Auditors expect an approved rationale for the weights, evidence they are reviewed rather than held static, and consistency with the assumptions used in stress testing and planning.
Post-model adjustments. An overlay is by definition a number that did not come out of the model, which makes it a natural place to test for management bias in either direction. A PMA that has sat unchanged for several periods without re-justification, or one sized to hit a target provision, is a red flag however good its paperwork.
Disclosure. Credit risk by stage, the movement in the loss allowance, and key assumptions and sensitivities must reconcile to the model output. A note that tells a different story from the model is a finding in itself.
What to have ready before the audit starts
Each of those areas maps to documentation an institution should already hold:
- a validated model inventory;
- a back-tested staging policy;
- a documented scenario-weighting rationale;
- a PMA log with sign-off evidence;
- a disclosure checklist reconciled to the model output.
Institutions that build these as they go spend far less time reconstructing them under audit pressure.
If you are not a lender
ECL is not only for banks. Any business reporting under IFRS 9 or a local equivalent must provide for expected losses on its trade receivables. Most use the simplified approach: lifetime expected losses from day one, usually through a provision matrix that applies loss rates by age band, adjusted for current and forward-looking conditions. The same audit questions apply on a smaller scale:
- Does the ageing reconcile to the ledger?
- Are the loss rates based on your own history?
- Is the forward-looking adjustment documented, or just a round number?
In short
No institution gets ECL right in one pass. The ones that manage the transition well tend to:
- dry-run the first year of a new framework;
- track gaps centrally, with a senior sponsor;
- invest in people and systems rather than stretching spreadsheets;
- use the same economic assumptions for ECL as for stress testing and planning.
Treated as a continuously monitored risk discipline rather than an annual accounting entry, ECL gives a provision that regulators, auditors and boards can actually trust.
Glossary
| Term | Meaning |
|---|---|
| ECL | Expected credit loss |
| SICR | Significant increase in credit risk |
| PD / LGD / EAD | Probability of default / loss given default / exposure at default |
| POCI | Purchased or originated credit-impaired |
| TTC / PiT | Through-the-cycle / point-in-time |
| EIR | Effective interest rate |
| CCF | Credit conversion factor |
| PMA | Post-model adjustment |
| SPPI | Solely payments of principal and interest |
| CECL | Current expected credit losses (US, ASC 326) |
This guide discusses expected credit loss under IFRS 9, its local equivalents and CECL at a general level. It is not accounting, regulatory or professional advice; apply the relevant standard and local regulatory guidance to your own circumstances.
How we help
We do not issue audit opinions. We help finance teams get ready for the audit. Our financial reporting work covers impairment policies, provision matrices and the disclosures that go with them. Our audit readiness review tests the evidence behind judgemental balances the way your auditors will, while there is still time to fix what we find.
Sources
Share this