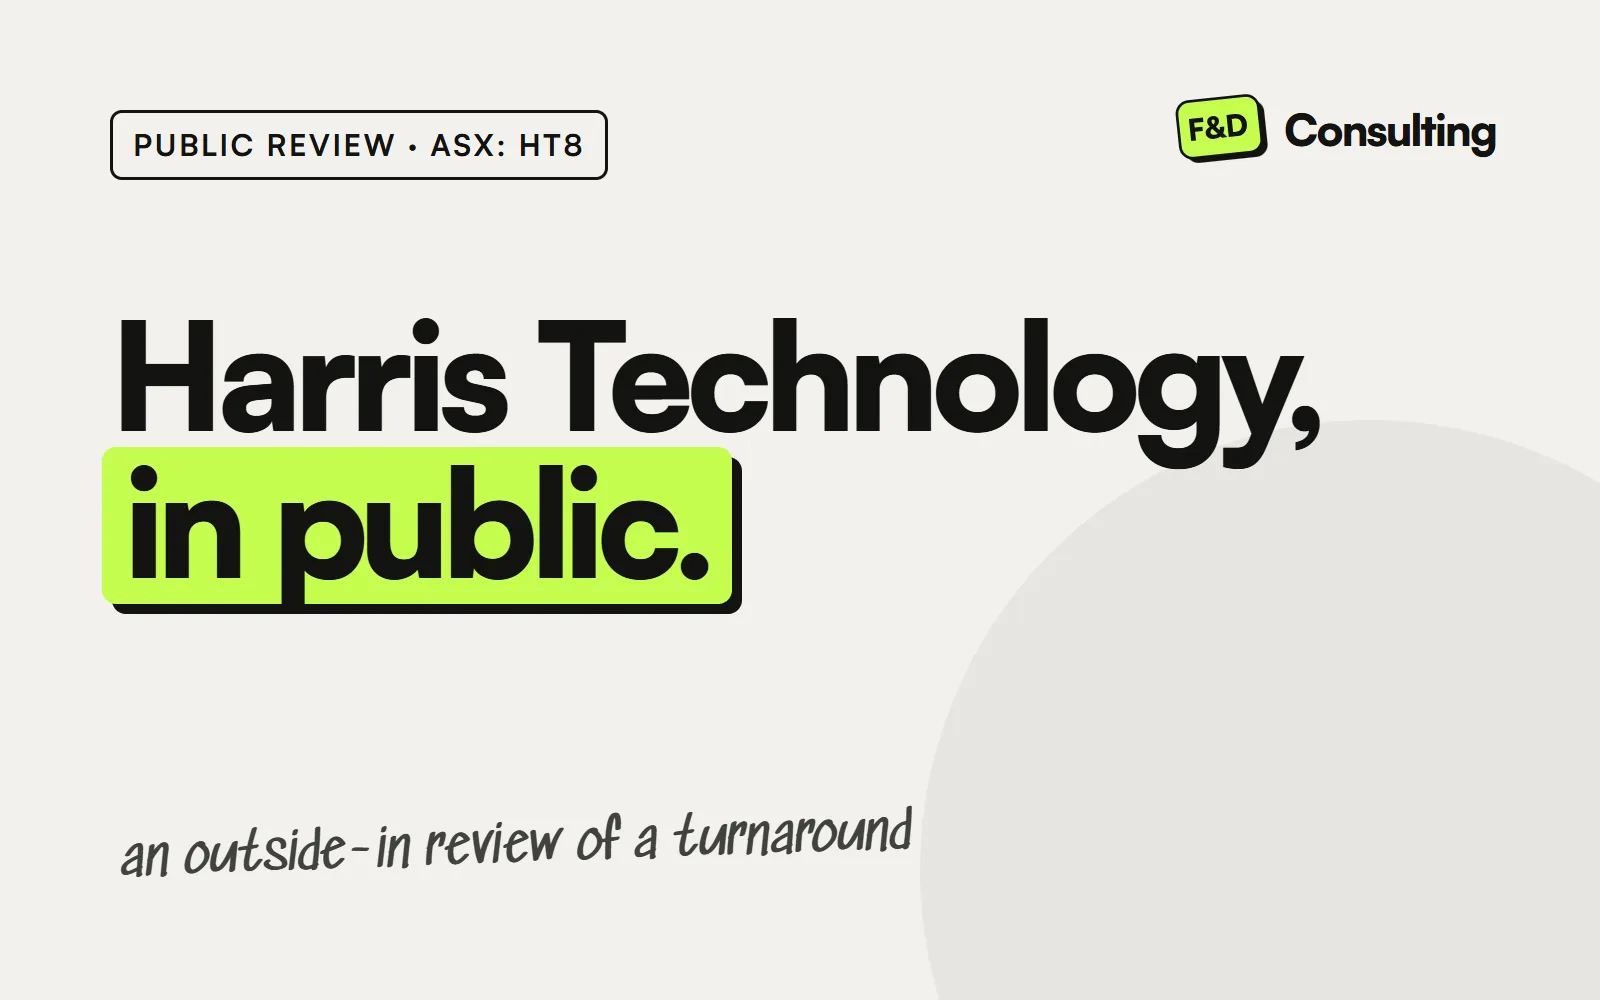
Harris Technology: what the public numbers say about a turnaround
A 28-person online tech retailer grew revenue 24%, cut its loss by 87% and turned cash flow positive. What the published numbers show, and the questions we would ask next.
- +24% revenue growth in FY26, to $17.2m
- $1.09m operating cash inflow, from a $0.53m outflow
- 11% of revenue spent on selling costs, down from 16%
About this review. This is an independent, outside-in review based only on published information as at . The company is not a client of F & D Consulting, has not been consulted, and we have no relationship with it. Nothing here is investment advice or an audit opinion, and it can only point to questions: the answers sit inside the business.
Our diagnostic normally starts inside a business: its ledgers, its systems and interviews with the people doing the work. This review does the opposite. It uses only what anyone can read about one real company, to show how we think about a business before we have seen inside it, and where the questions would lead.
We chose Harris Technology Group (ASX: HT8) because it is the size of business we work with, publishes detailed annual reports as a listed company, and sits exactly where finance and systems meet: an online retailer selling through its own store and through marketplaces.
The business
Harris Technology is an online technology retailer based in Melbourne, selling through its own store, ht.com.au, and through major online marketplaces. It had 28 employees at 30 June 2026, down from 30 a year earlier. Over the past two years it has pivoted towards refurbished technology, scaling down household product lines to do so, and has described itself as the number one refurbished IT seller on Amazon.
What the numbers say
FY26 is the year the published numbers turned. All figures are from the company’s annual reports; percentages of revenue are our calculations.
| Measure | FY25 | FY26 |
|---|---|---|
| Revenue | $13.83m | $17.16m |
| Gross margin | 35.9% | 33.5% |
| Selling expenses, % of revenue | 15.8% | 11.1% |
| Staff costs, % of revenue | 18.1% | 16.4% |
| Total operating expenses | $5.96m | $5.91m |
| Loss after tax | $0.96m | $0.12m |
| Operating cash flow | −$0.53m | +$1.09m |
| Employees | 30 | 28 |
Three things stand out.
Growth came without adding cost. Revenue grew 24% while total operating expenses were essentially flat. That is the operating leverage every growing business wants: each new dollar of sales costs less to serve than the last.
Selling costs fell sharply as a share of revenue. Selling expenses, which for a marketplace retailer typically include platform and transaction fees, fell from 15.8% to 11.1% of revenue. That one line accounts for much of the improvement, and it is exactly the kind of number worth understanding channel by channel.
Cash turned before profit did. The business generated $1.09 million from operations in FY26, after a $0.53 million outflow the year before, and reduced related-party borrowings from $1.95 million to $1.25 million. The FY25 accounts carried a material uncertainty about going concern; the FY26 accounts do not.
What changed in working capital
- Inventory held steady at $2.9 million while sales grew, so stock turned faster: by our calculation, from roughly 120 days of cost of sales on hand to roughly 93.
- Inventory write-downs fell from $110,000 to $35,000, and the provision for obsolete stock from $166,000 to $131,000.
- Trade payables rose from $1.56 million to $2.12 million, which also supported cash.
Inventory valuation was the auditor’s key audit matter in both years, which is expected for a business whose stock is its largest asset, particularly refurbished stock that has to be graded and valued unit by unit.
What customers say publicly
Public review sites tell a different story from the accounts. As at September 2026, Harris Technology is rated 2.0 out of 5 from 114 reviews on ProductReview.com.au and 2.9 out of 5 from 16 reviews on Trustpilot. The reviews span several years, but the recurring themes are consistent: wrong items or specifications shipped, damaged goods, and slow responses to emails and calls. Positive reviews mention price, range and staff who resolved problems well.
Review sites over-represent unhappy customers, and many of these reviews pre-date the refurbished pivot. But when the same themes repeat, they usually point to a process rather than a person.
Where our diagnostic would look next
From outside, we can only ask the questions. These are the ones we would take into a diagnostic, mapped to the six areas we score.
- Operations: order accuracy. When the public complaints cluster around wrong items shipped, the first question is how an order moves from marketplace or website to the warehouse, and where it is checked before it leaves. For refurbished stock, where two units of the same model can differ in grade and specification, that check matters more.
- Data and reporting: profit by channel. With selling costs moving by almost five percentage points in a year, the useful question is what each channel, whether the own store or each marketplace, earns after fees, freight, returns and write-downs. Revenue by channel rarely tells the full story.
- Automation: orders and stock across channels. A 28-person team running one store and several marketplaces is moving a lot of data between systems: orders, stock levels, prices, tracking. Wherever that is re-keyed or reconciled by hand, it costs hours and creates the kind of mismatch that ends in a wrong item.
- Technology: the customer-facing systems. The company names the reliability of its websites and systems as a principal risk. We would look at how customer enquiries are captured and tracked to resolution, because response time is the other theme in the reviews.
- Risk and controls: inventory. With inventory the auditor’s key matter, we would look at how refurbished units are graded, costed and counted, and how slow-moving stock is identified before it needs writing down.
- Financial management: sustaining the turn. The FY26 improvement came from growth with flat costs and faster-moving stock. The question for FY27 is which of those drivers are structural and which were one-off, and what would show early if either started to slip.
What we cannot see from outside
Public numbers show outcomes, not causes. We do not know how orders are processed, what systems connect the channels, how the team spends its time, or what management already knows and is fixing. Any of the questions above may already have good answers inside the business. That is the point of a diagnostic: it replaces questions like these with measured findings, ranked by what they cost.
Why we publish reviews like this
We would rather show how we think than tell you. If you want to see what the same approach finds with full access to your own numbers and systems, the diagnostic sets out how it works, and the sample report shows the format you receive.
Sources
Share this